
Every venture investor I know does the same thing before a first call. They open LinkedIn, scroll the founder's last twenty posts, and decide in two minutes whether the meeting is worth their time. The traction metrics you publish (or don't) are the single biggest signal in that scroll.
Most founders share the wrong numbers. They post pageviews, follower counts, app downloads. Investors don't care. The numbers that move investors are different, smaller in count, and more specific. Get this right and your inbound from VCs goes up. Get it wrong and your account looks like a million other startups.
Here are the 8 startup traction metrics worth posting in 2026, the 12 to retire, and how to frame each one so it lands with the audience that funds rounds.
What investors actually look for on a founder's LinkedIn

Investors pattern-match. They're looking for three things and three things only:
- Speed. Is something happening faster than expected?
- Quality of revenue. Are the right customers paying real money for the right reasons?
- Founder judgment. When you talk about your numbers, do you sound like someone who understands business or someone who's parroting metrics?
Every metric you post should serve one of those three questions. If a metric doesn't move signal on any of the three, it's filler.
The 8 traction metrics worth posting

1. Net new ARR added in the last 30 days
For B2B SaaS, this is the cleanest signal of velocity. Don't post total ARR (it ages out fast). Post the delta. "Closed $180K net new ARR in the last 30 days" tells an investor exactly how fast the company is growing right now.
2. Logos added (with names if allowed)
Named customers beat anonymous customer counts every time. "Reco, Frontegg, and Vanta joined this quarter" carries 100x the signal of "added 14 new customers this quarter." Get logo approval in your contracts so you can post them.
3. Net revenue retention (for products with expansion)
NRR over 120% is the gold standard. Investors recognize it immediately and assume product-market fit. Most founders never share this. The ones that do get inbound.
4. Sales cycle compression
"Average enterprise sales cycle dropped from 84 days to 41 days after we shipped feature X." This is the metric that signals you've cracked a positioning problem. Few founders share it.
5. Burn multiple
ARR added divided by net cash burned in the same period. Under 1.0 is excellent. Under 2.0 is solid. Posting your burn multiple says "I think like a CFO" and that's a positive signal for any investor.
6. Pipeline conversion rate by stage
"Stage-2 to closed-won rate went from 11% to 28% after we revamped the demo flow." This shows you measure the pipeline like an operator, not a hopeful founder.
7. Magic number (for sales-led businesses)
Quarterly net new ARR divided by prior-quarter sales and marketing spend. Magic number above 1.0 means sales is efficient. Investors love a public magic number callout because most founders can't calculate theirs.
8. A specific design partner or pilot result
"Lasso ran a 6-week pilot with our agent security platform and reduced incident response time from 47 minutes to 4 minutes." A single concrete pilot result outperforms a dozen "customers love us" claims.
The 12 metrics to retire from your founder feed
Stop posting these. They make you look like an early-stage marketing intern, not a founder.
- Total website traffic
- LinkedIn follower count
- Total signups (unless you're consumer)
- App downloads (unless you're consumer)
- Total impressions on any post
- Number of demo requests (without conversion rate)
- Team headcount as a brag ("we hired 12 people")
- Office openings
- Conference attendance ("we were at RSA")
- Number of features shipped
- Total GitHub stars (unless they hit a milestone like 10K+)
- Vanity NPS without a comparison cohort
Each of these tells an investor nothing about whether your company will work. They're noise.
How to frame numbers without sounding boastful

The number isn't the post. The story around the number is the post. Three frames that always work:
Frame 1: The surprising delta. "We thought our enterprise sales cycle would shrink by 20% after we added the security questionnaire automation. It dropped 51%. Here's what we learned." The unexpected outcome is the hook.
Frame 2: The honest tradeoff. "Our NRR is 134%. Our gross retention is 87%. Here's the tension we're navigating between expansion and churn." Honesty about the tradeoff makes the strong number more credible.
Frame 3: The customer-first credit. "Reco hit $X by helping CISOs solve Y. The pattern that worked is: [specific insight]." The metric becomes a vehicle for an insight, not a brag.
If your post reads like a stat dump, it lands flat. If it reads like an operator thinking out loud, it wins.
Examples from B2B SaaS, deep-tech, and cybersecurity founders

B2B SaaS: "Q1 NRR was 142%. The biggest single driver was a new pricing tier we shipped in November. Before/after data inside." Then walk through the change. Investors save this post.
Cybersecurity: "Customer X reduced mean time to detect from 6 hours to 11 minutes after we deployed. Here's the architecture decision that made it possible." Specific, technical, defensible.
Deep-tech: "Hit 47% lower compute cost per inference vs. baseline. The trick was [specific technique]. Here's why it matters for the next wave of agent applications." Technical depth signals to deep-tech investors.
Cadence and timing for metric posts
Two rules:
- Don't post a metric every day. Once a week is plenty. More than that and you sound like you're performing.
- Pair the metric with the lesson. Every metric post should teach something other founders can use. Otherwise it's a brag.
The right cadence: one metric-driven post per week, two narrative posts per week (lessons, opinions, customer stories), occasional commentary on industry news. The metric posts are the heaviest content; the narrative posts carry the relationship.
What to avoid: the 3 ways founders blow their numbers

1. Inflating with "approximately." Investors notice. If you can't share the exact number, share a range with explicit context. "ARR between $4M and $5M, exact number TBD pending Q1 close" is fine. "Approximately $5M" reads as inflated.
2. Hiding the denominator. "1,200 new signups this month" is meaningless without conversion. Either include the next-stage conversion or skip the metric.
3. Posting only when the numbers are good. Investors notice the silence. Founders who only post wins look promotional. Founders who occasionally post "we missed our number this quarter and here's why" build outsized credibility.
Frequently asked questions
What traction metrics do investors actually care about?
For B2B SaaS: net new ARR, NRR, burn multiple, magic number, and specific customer outcomes. For deep-tech and consumer: less standardized, more about technical proof or user retention. Always: speed, quality of revenue, and founder judgment.
Should I share revenue numbers publicly on LinkedIn?
Yes, with care. Net new ARR is fine. Logo names with approval are fine. Total ARR or revenue is risky because competitors can use it against you in deals. The default rule: share deltas and ratios, be careful with absolutes.
How often should I post traction metrics?
Once a week max. More than that signals performative posting. The right ratio is one metric post for every two narrative posts.
What if my numbers are not impressive yet?
Then post deltas and ratios, not absolutes. "Conversion rate up 3x in 60 days" is a stronger metric for an early-stage company than "we have $40K MRR." Trends matter more than levels at seed and Series A.
Can I post traction metrics if I'm in stealth?
Not numbers. But you can post pattern observations, design partner insights without naming them, and frameworks you've validated. See our LinkedIn for stealth startups guide for the specific playbook.
Do investors actually read founder LinkedIn posts?
Yes. Most VC partners scroll a founder's LinkedIn before they take a first call and definitely before they make an offer. They're looking for the three signals above. Make sure your last 20 posts answer them.
How do I track whether my metric posts are working?
Two signals: inbound DMs from investors (not just connections, real DMs with a question), and meeting acceptance rate on cold partner-tier outreach. Both should rise once your metric posts are landing.
Your next move
Pick the three metrics from the "worth posting" list that are most defensible for your business right now. Write one post per week for the next four weeks. Track DMs from your target investors. If you don't see signal in 30 days, your framing is the issue, not the metric. We help founders working through fundraising cycles tighten this exact loop at Foundera.
Three founder archetypes and the metric mix that fits each

The traction metric that signals well for a $50M ARR Series C founder is the wrong one for a seed-stage founder. Match the metric to the stage:
Seed and pre-seed. You don't have ARR worth posting. Post product velocity, design partner outcomes, and qualitative customer-pull signals. Best post: "Built X in 6 weeks. Three CISOs already running it in production. Here's the architecture decision that made the timeline possible." The investor signal is speed-of-iteration and depth-of-customer-conversation, not revenue.
Series A. Revenue is starting to compound but is too small to anchor. Best metrics: net-new ARR (deltas, not totals), logo names, customer outcome stories with measurable improvements. Avoid posting your absolute ARR - it ages out within a month and competitors will use it in deal motion.
Series B and beyond. Now you can lead with NRR, magic number, burn multiple. Investors at this stage want efficiency proof, not just growth proof. The most-saved posts at this stage are the ones that share an honest tradeoff: "We hit 142% NRR by sacrificing X. Here's the calculus."
How to handle a quarter you missed

The biggest credibility-building move is posting an honest miss. Most founders go silent. The ones who post "we missed our number this quarter and here's exactly why" build outsized investor trust.
Template that works: state the miss, the cause (specific, not vague), the fix already in motion, the metric that will tell you the fix is working, and the date you'll report back. Five sentences. No spin.
Investors save this kind of post and remember the founder when their next round comes around. The contrarian truth: a transparent miss often does more for your fundraise than a vanity win.
One last filter before you post a number
Before any metric post ships, run this single test: imagine your top three competitors reading the post tomorrow morning. Does the number help them or hurt you? Specific deltas (net new ARR, NRR, magic number) help you because competitors can't act on them. Absolute revenue and customer counts hurt you because competitors can quote them in their own deal motion. When in doubt, post the rate, not the absolute. Investors prefer rates anyway because rates predict the next twelve months. Absolutes only describe the last twelve.
How to present numbers visually on LinkedIn

Numbers without visuals are 40% less likely to get saved or reshared. Three formats that consistently work on LinkedIn for metric posts:
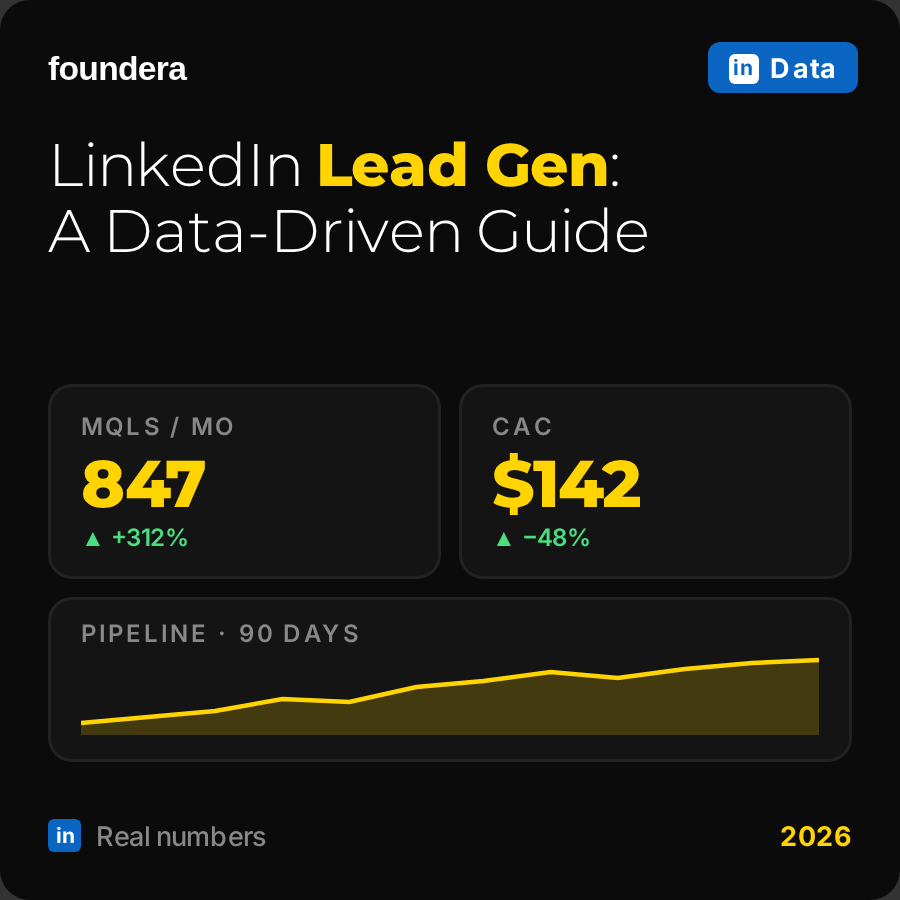
Format 1: The single-number hero image. A clean image with one number in the largest font and a one-line label. "$2.4M net new ARR - Q1 2026" centered on a brand-colored background. Posts with this format get screenshotted and shared. The hero number does the work; the post copy adds context.
Format 2: The before-and-after split. Two side-by-side panels. Left: "Before the new pricing tier - 84-day sales cycle." Right: "After - 41 days." The contrast is the hook. Founders who post this format almost always get DMs asking what they changed.
Format 3: The simple bar comparison. Three to five bars showing your number against named comparables (yourself last quarter, an industry benchmark, a competitor if you can name one without legal risk). The visual makes the relative position immediately obvious.
Avoid: line charts with more than two series, pie charts of any kind, anything that requires zooming to read on a phone. LinkedIn is consumed on mobile in 4-second glances.
Investor-side patterns: what they screenshot and share

Investors are creatures of pattern recognition. When a metric post lands, it gets screenshotted into a Slack channel labeled "watch list" or "round 2026 H1." Three patterns we've watched investors react to:
Pattern 1: The unexpected ratio. "Net new ARR / cash burn this quarter: 1.6x." That's a burn multiple post. Investors who see this immediately mentally compare against the benchmark and either save the post or open the company's website. The ratio is more diagnostic than the absolute number on its own.
Pattern 2: The cycle compression delta. "Sales cycle dropped from 87 to 39 days after we shipped the SSO integration." Investors save this because it implies the company solved a specific friction point that other portfolio companies face.
Pattern 3: The honest miss with a fix. "Q1 NRR was 104%. Below our 120% target. Here's the specific customer segment driving the drop and what we shipped to fix it." This post is the one investors share most often, internally. It's the founder version of an earnings call - and it builds outsized trust.
The pattern across all three: investors share specific, instrumented thinking. They don't share brags.
What to do when you can't share the number
There are quarters where the real number is too sensitive to share publicly: pre-fundraise, mid-deal negotiation, competitive timing. The mistake is going silent.
Better move: share the qualitative pattern. "We made a pricing change in November. The result through Q1 was significant enough that we're keeping the change and rolling it across all customer segments." That post tells investors "something material happened" without disclosing specifics. The follow-up DM is where the actual number comes out.
This pattern works because it preserves the relationship signal (you're communicating to your network) without exposing the competitive data. Founders who use this regularly are the ones VCs reach out to first when they're looking for deals in your category.
A note on competitor metric posts

When a competitor posts impressive numbers, the temptation is to either match them or denigrate them. Both moves are weak.
Better play: ignore them publicly. If you have your own numbers that are real and defensible, post yours on your own schedule. If you don't, posting reactive metrics that try to one-up a competitor reads transparent and desperate to anyone in your space.
The founders investors trust are the ones who run their own race in public. The ones who post reactive metrics every time a competitor does something get categorized as the second-place company in their category - even if their underlying numbers are better.
A final note on cadence over volume
Posting eight metrics in one week then nothing for a month signals erratic operator energy to investors. Posting one metric every two weeks for two years signals a real company being built. Investors trust cadence more than volume.
The TL;DR
Quick answer
For B2B SaaS founders posting on LinkedIn in 2026, the eight traction metrics that move investors are: net new ARR, named logos, NRR, sales cycle compression, burn multiple, pipeline conversion rate by stage, magic number, and a specific design partner result. Skip total ARR, pageviews, and follower counts - they signal nothing to VCs.
Key takeaways
- Investors pattern-match on speed, quality of revenue, and founder judgment. Every metric should serve one of these.
- Post deltas, not absolutes. Net new ARR beats total ARR. Trends matter more than levels at every stage.
- Named logos beat anonymous customer counts 100x. Get logo approval in your contracts.
- Honest miss posts build outsized credibility. State the miss, cause, fix, and report-back date in five sentences.
- Once a week max. More than that and you sound performative. Pair every metric with a lesson.