LinkedIn Impressions & Engagement Rate: The 2026 Founder Benchmark Report
The average LinkedIn engagement rate in 2026 is 5.20% of impressions, up 8% year over year, per Socialinsider's benchmark study of 1.3 million posts — and a typical personal-profile post earns between 575 and 1,400 median impressions depending on its length, per AuthoredUp's analysis of 372,126 posts. Those two numbers come from different datasets measuring different account types, which is exactly why most benchmark articles mislead you.
This is the report we wished existed: every verified LinkedIn impressions and engagement benchmark we could find, aggregated into one founder reference — with formulas defined, datasets labeled, and six numbered findings you can cite.
Table of Contents
- How to Read This Report
- The Math: Two Engagement-Rate Formulas
- Finding 1: The Average Engagement Rate Is 5.20% — With an Asterisk
- Finding 2: Impressions — What a Normal Post Actually Gets
- Finding 3: Format Multipliers — Carousels, Saves, and Video
- Finding 4: Frequency Is the Biggest Lever
- Finding 5: Reach Is Falling for Almost Everyone
- Finding 6: What Good Looks Like for a Founder Account
- Frequently Asked Questions
How to Read This Report
Four large datasets power the findings below. Knowing which is which prevents the single most common benchmarking mistake — comparing your personal profile against company-page data:
- Socialinsider — 1.3M posts from 16,645 company pages, Jan 2024–Dec 2025.
- AuthoredUp — 372,126 personal-profile posts (length/impressions analysis), a 621,833-post algorithm dataset, and 994,894 personal + 305,842 company posts for format multipliers.
- Buffer — 2M+ posts from 94,000+ accounts (frequency and format).
- Richard van der Blom's Algorithm Insights Report 2025 — 1.8M posts, covered by WrittenlyHub.
Every number below carries its dataset. Where the only available figure is a vendor synthesis rather than a study, we say so.
The Math: Two Engagement-Rate Formulas
"Engagement rate" means two different calculations, and mixing them makes benchmarks meaningless.
Impressions-based ER (what Socialinsider and most 2026 studies report):
ER = (reactions + comments + shares) ÷ impressions × 100
This measures how compelling the content was to the people who actually saw it. It's the fairest cross-account comparison and the formula behind the 5.20% average.
Follower-based ER (the older convention):
ER = (reactions + comments + shares) ÷ followers × 100
This conflates content quality with reach, and it punishes big accounts arithmetically: as Linkboost's benchmark guide illustrates, 200 likes is a 10% follower-based ER on a 2,000-follower account but 2% on 10,000 followers — same performance, five times "worse." Smaller accounts naturally post higher follower-based ERs.
When you benchmark yourself, use impressions-based ER, and compare personal profiles only against personal-profile data.
Finding 1: The Average Engagement Rate Is 5.20% — With an Asterisk
Socialinsider's 2026 benchmarks put LinkedIn's average engagement rate by impressions at 5.20%, up 8% year over year. The asterisk: that's company-page data, and it's skewed upward by top performers.
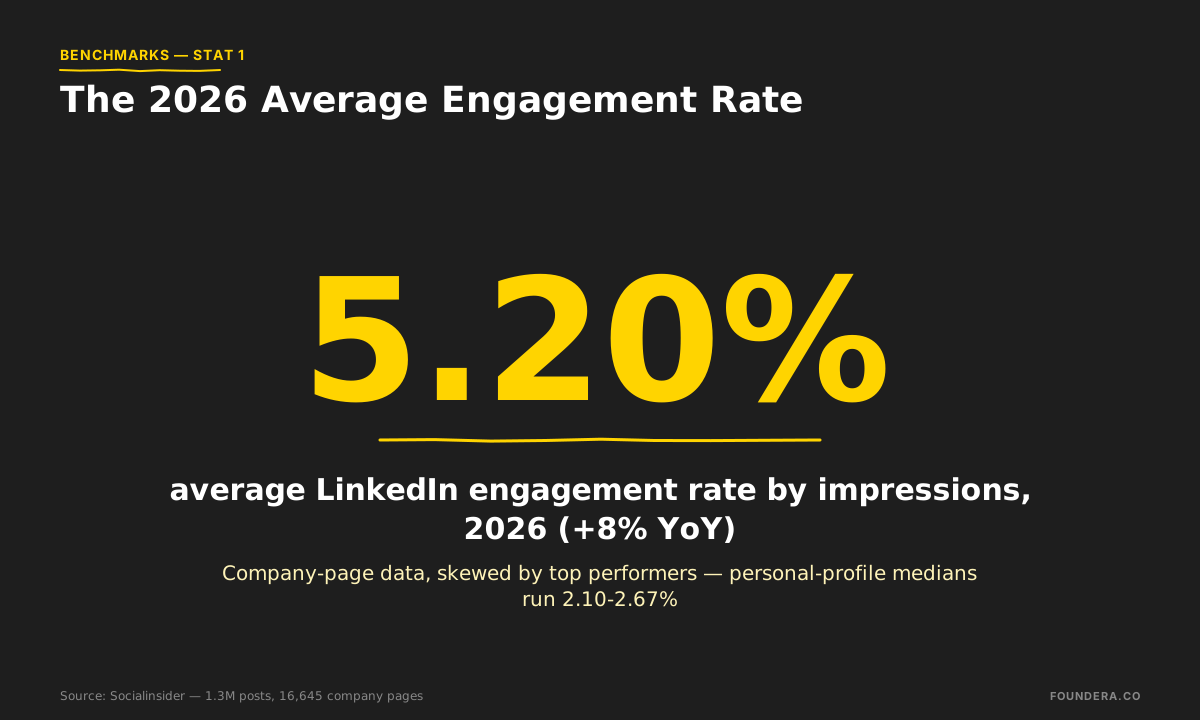
The personal-profile picture is more modest — and more honest for founders. AuthoredUp's 372,126-post analysis found median engagement rates of 2.10% for posts under 400 characters, rising to 2.67% for posts of 2,001–2,500 characters. Medians resist the top-performer skew that averages invite.
Vendor syntheses (such as Linkboost's) converge on a working rule of thumb: roughly 4–6% is a good engagement rate for personal profiles, 2–3% for company pages. That's a practitioner consensus, not a controlled study — use it as a target band, not a law.
| Source | Account type | Engagement rate | Basis |
|---|---|---|---|
| Socialinsider | Company pages | 5.20% average (by impressions) | 1.3M posts — skewed by top performers |
| AuthoredUp | Personal profiles | 2.10–2.67% median (by length) | 372,126 posts |
| Linkboost (vendor synthesis) | Personal / company | 4–6% good / 2–3% good | Practitioner benchmark, not a study |
Finding 2: Impressions — What a Normal Post Actually Gets
For small company pages (1,000–5,000 followers), Socialinsider's impressions table sets realistic expectations by format: native documents 525 average impressions, multi-image 490, video 355, image 315, text 300, link posts 235.
For personal profiles, AuthoredUp's data shows median impressions climb with post length: 575 for posts under 400 characters, 1,106 at 1,301–2,000 characters, 1,174 at 2,001–2,500, and 1,400 at 2,501–3,000. Longer posts also engage better — posts of 1,301–2,500 characters generate 27% higher engagement than posts under 400 characters.

Two cautions before you compare your own numbers. First, no credible founder- or CEO-specific impressions benchmark exists publicly — the honest move is to benchmark a founder account against the personal-profile rows above, not against an invented "CEO average." Second, if your median post clears 1,400 impressions, you're already above the median line of a 372K-post dataset; calibrate ambition accordingly, and study how outlier posts actually happen before expecting them weekly.
Finding 3: Format Multipliers — Carousels, Saves, and Video
Format is the highest-leverage editing decision after the idea itself. Three layers of verified data:
Engagement rate by format (company pages, Socialinsider 2025 data): native documents 7.00% (+14% YoY), multi-image 6.45%, video 6.00%, image 5.30%, text 4.50%, polls 4.20%, links 3.25%.

Reach multipliers (personal profiles, AuthoredUp, 994,894 personal posts): polls 1.64x, documents/carousels 1.45x, images 1.18x, video 1.10x, plain text 0.88x. On company pages, text collapses to 0.42x.
Engagement deltas (Buffer, 2M+ posts): images get 72% more engagement than text and video 84% more — but carousels dominate everything, with 278% more engagement than video, 303% more than images, and nearly 600% more than text posts. Van der Blom's 2025 report adds that native video earned a 69% performance boost (especially vertical, under 60 seconds) and posts with images of people perform up to 50% better than posts without faces, while text-only engagement fell ~18% (WrittenlyHub coverage).
Then there's the quiet multiplier most founders ignore: saves. Per AuthoredUp, one save gives a post 5x the reach of one like, a saved post means a 130% higher chance the saver follows you, and consistently-saved creators grow their audiences 3x faster. The catch: fewer than 3% of posts get saved at all. LinkedIn made save and send counts visible metrics in late 2025, and the algorithm now weights saves, sends, meaningful comments, and dwell time above likes.

Comment mechanics compound the effect: comments count roughly 2x likes in the engagement-testing stage, posts whose comment sections contain real discussion (replies to other comments) see up to 2.4x more reach, and replying to comments on your own posts boosts engagement by 30% (Buffer). Meanwhile, single-link posts get the lowest reach of any configuration — though bundling 4+ links flips to 3–5x higher median reach — and hashtags have had no measurable reach impact for 8+ months, with 6+ actively hurting (AuthoredUp).
Finding 4: Frequency Is the Biggest Lever
No format tweak compares to simply posting more, per Buffer's study of 2M+ posts from 94,000+ accounts. Versus posting once a week:
| Frequency | Impressions per post | Engagement rate lift |
|---|---|---|
| 2–5 posts/week | +1,182 | +0.23pp |
| 6–10 posts/week | +5,001 | +0.76pp |
| 11+ posts/week | +16,946 | +1.4pp, ~3x engagements per post |

Note the direction of the numbers: impressions per post go up as you post more. Frequency doesn't cannibalize — it compounds, and Buffer found the effect holds whether you have 500 followers or 50,000. Combined with the fact that posting time barely matters compared to cadence, the operational takeaway for a founder is one sentence: pick a sustainable frequency of 2–5 posts per week, and protect it like a board meeting.
Finding 5: Reach Is Falling for Almost Everyone
If your impressions dropped this year, that's the platform, not your content. Average reach fell 34% in 2025, and reach is down year-over-year for 98% of users, per AuthoredUp's 621,833-post dataset. Van der Blom's Algorithm Insights Report 2025 measures the same slide from a different angle: organic views down 50%, engagement down 25%, follower growth down 59% (WrittenlyHub).

This is deliberate platform policy, not decay. LinkedIn editor-in-chief Daniel Roth has confirmed the company is intentionally helping content reach more relevant audiences rather than larger ones. Feed composition tells the story: Top Creator content now takes 31% of the feed, other creators 28%, promoted company content 28%, ads 11% — and organic company content just 2%, down from ~7% in 2021 (AuthoredUp / van der Blom feed analysis).
That last number is the strategic headline for founders. Company pages now reach only ~1.6% of their followers on average, while personal profiles receive 561% more reach than company pages (van der Blom, 1.8M posts). The benchmark implication: a founder posting as themselves isn't a nice-to-have — it's the only organic distribution channel with real capacity left. The full mechanics are in how LinkedIn reach works and the 2026 algorithm guide for founders.

One consolation: distribution now has a long tail. Posts that spark meaningful conversation stay visible in the feed for 2–3 weeks (AuthoredUp) — so a well-built post keeps earning impressions long after its launch day.
Finding 6: What Good Looks Like for a Founder Account
Pulling every verified row together, here is the benchmark table for a founder posting from a personal profile in 2026:
| Metric | Working target | Basis |
|---|---|---|
| Median impressions per post | 575–1,400 (rises with length) | AuthoredUp, 372K personal posts |
| Engagement rate (impressions-based) | 2.1–2.7% median; 4–6% is strong | AuthoredUp medians; vendor synthesis for the upper band |
| Cadence | 2–5 posts/week minimum (+1,182 impressions/post vs 1x) | Buffer, 2M+ posts |
| Post length | 1,301–2,500 characters (+27% engagement vs short) | AuthoredUp |
| Format mix | Documents/carousels first (1.45x reach, ~600% engagement vs text) | AuthoredUp + Buffer |
| Saves | Any saves at all put you in the top tier (<3% of posts get saved) | AuthoredUp |
| First hour | Reply to every comment (+30% engagement; comments count 2x likes) | Buffer + AuthoredUp |

Three usage notes. First, these are personal-profile benchmarks — measuring a founder account against Socialinsider's 5.20% company-page average will make you feel either falsely great or falsely terrible. Second, medians beat averages for goal-setting; one outlier post shouldn't reset your targets. Third, benchmarks describe the platform, not your pipeline — impressions and engagement only matter insofar as they produce profile views that convert to conversations. For the broader evidence on why executive content earns disproportionate trust, see our LinkedIn thought-leadership statistics roundup.
Frequently Asked Questions
What is a good engagement rate on LinkedIn?
For personal profiles, median performance is 2.10–2.67% of impressions (AuthoredUp, 372K posts), and vendor benchmarks call 4–6% strong. For company pages, 2–3% is good; Socialinsider's 5.20% platform average is company-page data skewed by top performers. Always specify impressions-based vs follower-based — the formulas produce very different numbers.
How many impressions is good for a LinkedIn post?
On a personal profile, the median runs 575 impressions for short posts up to 1,400 for posts of 2,501–3,000 characters (AuthoredUp). Small company pages (1–5K followers) average 235–525 impressions per post depending on format (Socialinsider). Clearing 1,400 consistently puts a founder above the personal-profile median.
How is LinkedIn engagement rate calculated?
Impressions-based: (reactions + comments + shares) ÷ impressions × 100 — the modern standard. Follower-based: the same numerator ÷ followers × 100 — older, and it penalizes large accounts: 200 likes is 10% on 2,000 followers but 2% on 10,000. Use impressions-based ER for benchmarking and be explicit about which formula a source uses.
Why are my LinkedIn impressions dropping?
Platform-wide compression: average reach fell 34% in 2025 and is down for 98% of users (AuthoredUp); van der Blom's report measured organic views down 50%. LinkedIn is deliberately routing content to more relevant, not larger, audiences. Counter-moves with verified lifts: post 2–5x/week (+1,182 impressions/post), use documents/carousels (1.45x), and engineer saves and comments.
What LinkedIn post format gets the most impressions and engagement?
Documents/carousels lead nearly every dataset: 7.00% engagement rate (Socialinsider), 1.45x reach multiplier (AuthoredUp), and ~600% more engagement than text (Buffer). Polls carry the highest raw reach multiplier (1.64x) but the lowest format ER (4.20%). Native video earned a 69% boost in van der Blom's 2025 data — vertical, under 60 seconds.
Do saves really matter on LinkedIn?
More than any other single signal. One save equals 5x the reach of a like and boosts distribution twice as much as a meaningful comment; a saver is 130% more likely to follow you; and consistently-saved creators grow 3x faster (AuthoredUp). Fewer than 3% of posts get saved — build reference-quality content (frameworks, benchmarks, checklists) and you're competing in a nearly empty lane.
TL;DR
- Average LinkedIn engagement rate 2026: 5.20% of impressions (Socialinsider, company pages, skewed high). Personal-profile medians: 2.10–2.67% (AuthoredUp); 4–6% is strong (vendor synthesis).
- Median personal-post impressions: 575–1,400, rising with length; long posts (1,301–2,500 chars) engage 27% better than short ones.
- Format multipliers: carousels ~600% more engagement than text, 1.45x reach; 1 save = 5x a like and a 130% follow lift; comments count 2x likes; replying to your own comments adds 30%.
- Frequency is the biggest verified lever: 2–5 posts/week adds +1,182 impressions per post vs weekly; 11+ adds +16,946 (Buffer).
- Reach fell for 98% of users (-34% average; views -50% per van der Blom) — by design. Personal profiles get 561% more reach than company pages, which now reach ~1.6% of followers.
- Use impressions-based ER, compare personal against personal-profile data only, and treat medians — not viral outliers — as your baseline.
Related Reading
- How LinkedIn Reach Works
- The LinkedIn Algorithm in 2026: A Founder's Guide
- Best Time to Post on LinkedIn: Why the Studies Disagree
- LinkedIn Profile Views: What They Signal for Founders
- The Anatomy of Viral LinkedIn Posts by Founders
- The LinkedIn Hooks Library for Founders
- Taplio Alternatives for Founders
- Cleverly Alternatives for Thought Leadership
- LinkedIn Automation Tools: What Founders Risk